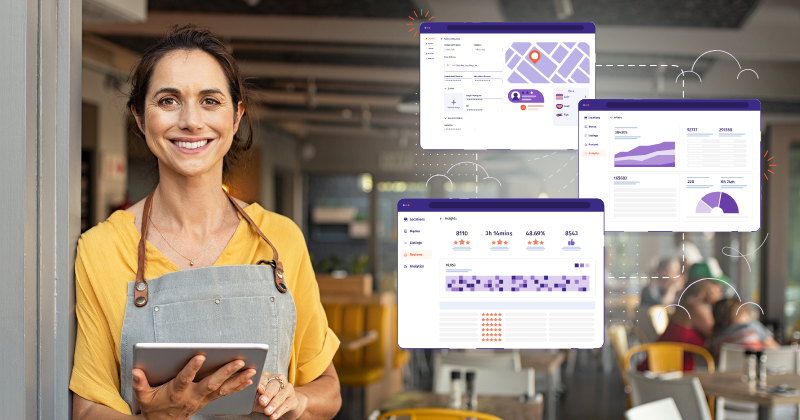
Leveraging Marqii’s Analytics Dashboard: A Deep Dive for Restaurant Owners
Marqii’s Analytics Dashboard makes accessing valuable insights that help you make data-driven decisions easier than ever. Whether you're refining your local SEO strategy or looking to improve customer satisfaction, Marqii's Analytics Dashboard has everything you need. Let’s take a tour of the three main sections and explore how each one can drive growth for your restaurant.
1. Listings Engagement: Supercharge Your Local SEO
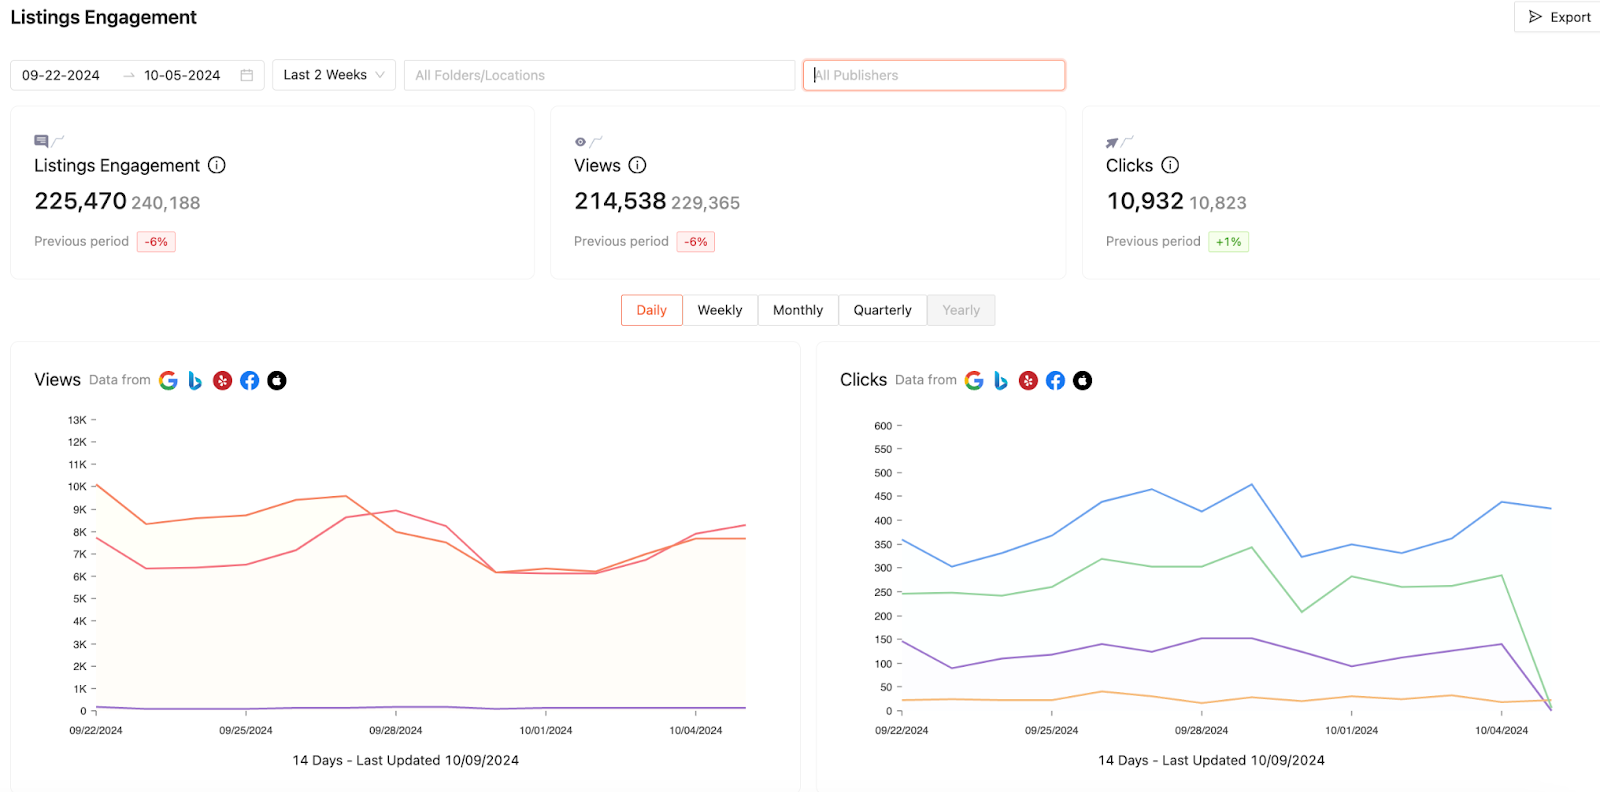
The Listings Engagement section is your go-to for tracking how your restaurant’s business listings are performing across platforms like Google, Yelp, Apple, and more. Maintaining up-to-date listings is important to capturing attention and converting clicks into customers. This section shows you key metrics such as:
- Impressions: How many people have seen your listing.
- Clicks/Actions: How many users have clicked through, called, or requested directions.
- Other: This varies by publisher. For Google, this is how many people click on your menu. For Yelp, this is user check-ins, bookmarks, and Call-To-Action clicks.
This data is great for tracking how well your local SEO is doing. By tracking impressions and clicks, you can understand which platforms drive the most engagement and fine-tune your listing content. For instance, if your Google listing is generating more impressions but not enough clicks, a quick update to your photos or business description could do the trick. If you notice your Yelp listing isn’t getting as many impressions as other publishers, this may mean that you may need to update information on your Yelp.
2. Search Appearances: The Key to Winning SEO
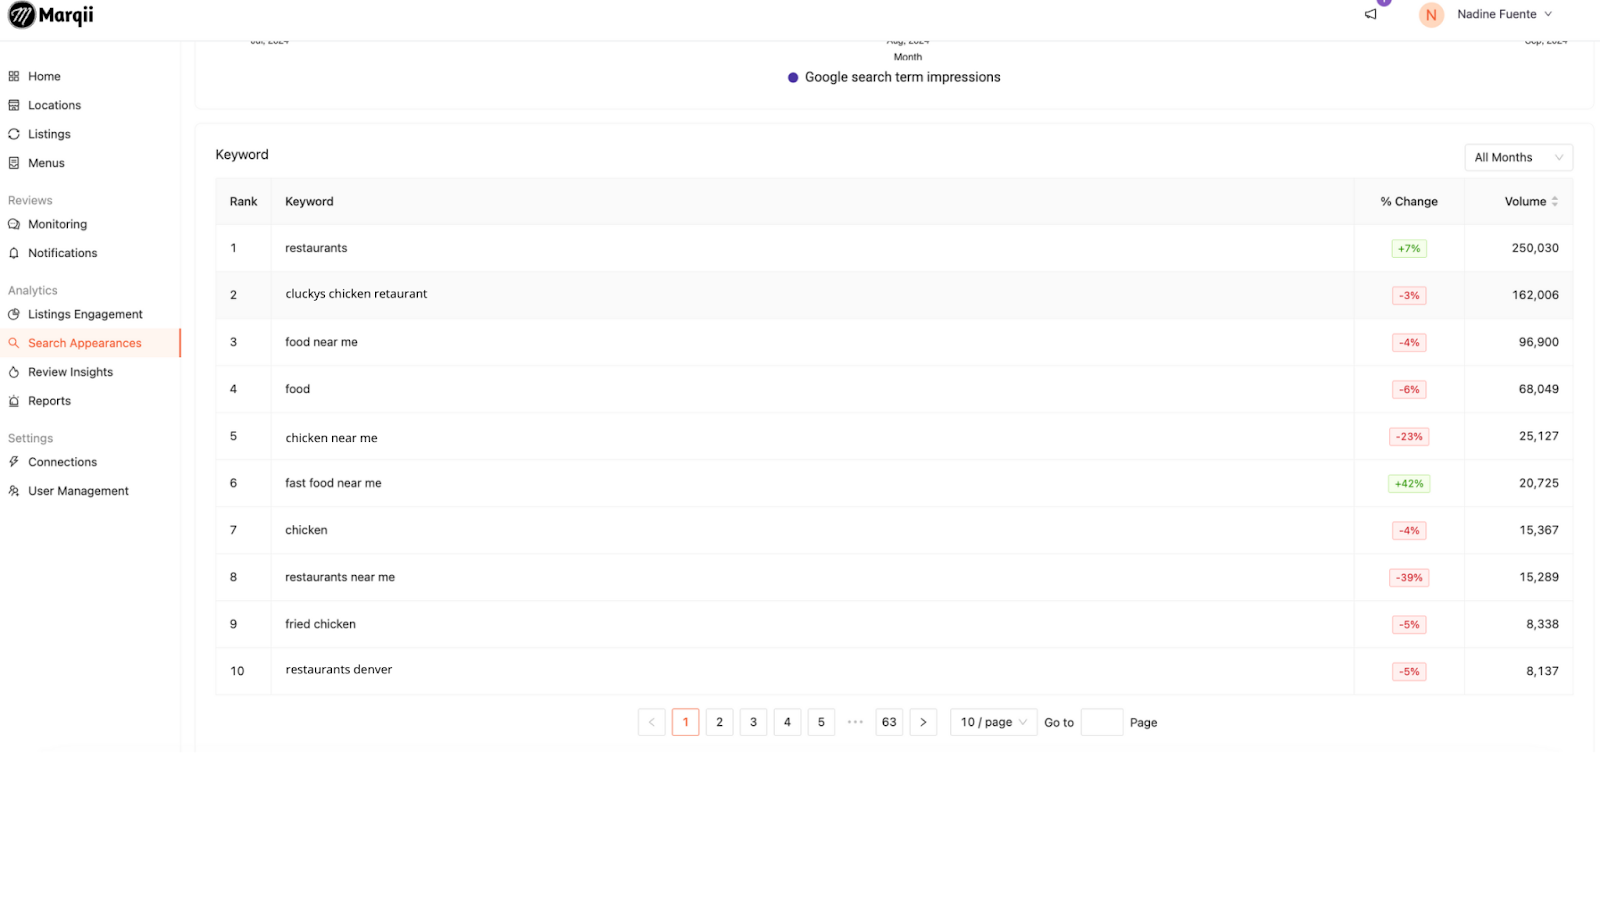
In the Search Appearances section, Marqii pulls in data directly from Google to show you the exact keywords customers are using to find your restaurant. This data is huge for your SEO strategy. You can view month-over-month comparisons to see how customer search habits are evolving and even discover new keywords to target in your marketing efforts.
Tracking keyword trends allows you to stay ahead of the competition. For example, if you notice that "best taco restaurant near me" consistently drives traffic, you might want to optimize your content around this phrase. By tweaking your website and listings, you can capture even more of those high-value search appearances.
3. Review Insights: Turning Feedback Into Actionable Insights
Customer reviews are more than just feedback—they’re a goldmine of information that can shape your customer experience and marketing strategy. The Review Insights section breaks down reviews across three categories: Review Analysis, Sentiment Analysis, and Keyword Analysis.
Review Analysis
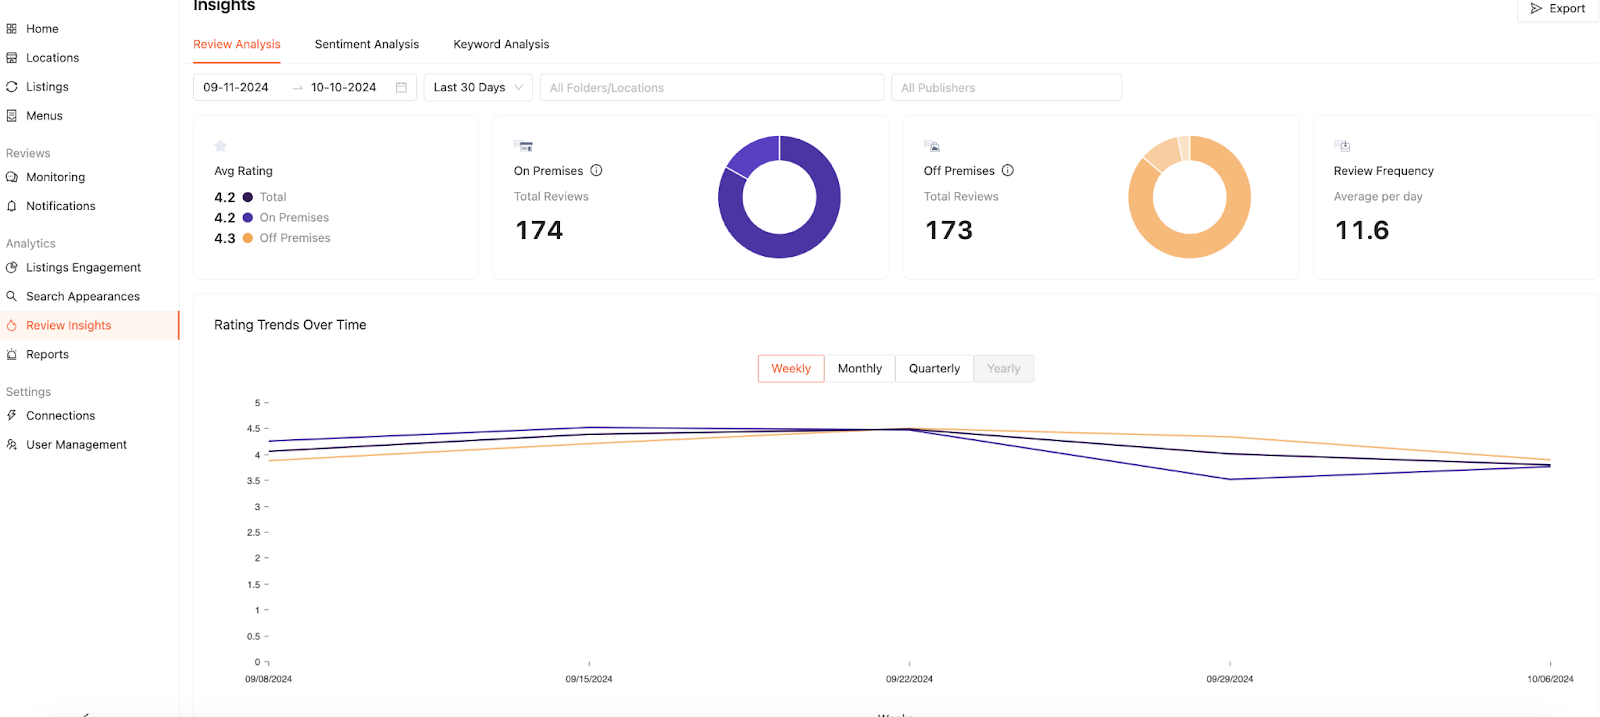
Want to know how your restaurant is performing on-premise vs. off-premise? Review Analysis gives you a snapshot of reviews across all platforms broken down into Off-Premise and On-Premise. Off-Premise includes UberEats, GrubHub, and EZCater data, while On-Premise includes Google, Yelp, Facebook, TripAdvisor, and OpenTable data.. Knowing where you are doing well and where you can improve is important to the customer experience.
CEO of Big Chicken, Josh Halpern, talks about the process of deciding to change up their french fries.
Big Chicken noticed that off-premise, the quality of their fries was not holding up. They were able to take this data and change their fries to deliver a better experience to the customer, no matter where they were eating. Data like this can help restaurants identify pain points and improve, delivering a better experience.
With Review Analysis, you can also track review frequency, which shows the average number of reviews collected over any selected date range. This metric is a great way to measure customer satisfaction over time. It can also help you see if customers are leaving reviews or not.
All of this data can also be broken down location by location so you can compare how each is doing.
Sentiment Analysis
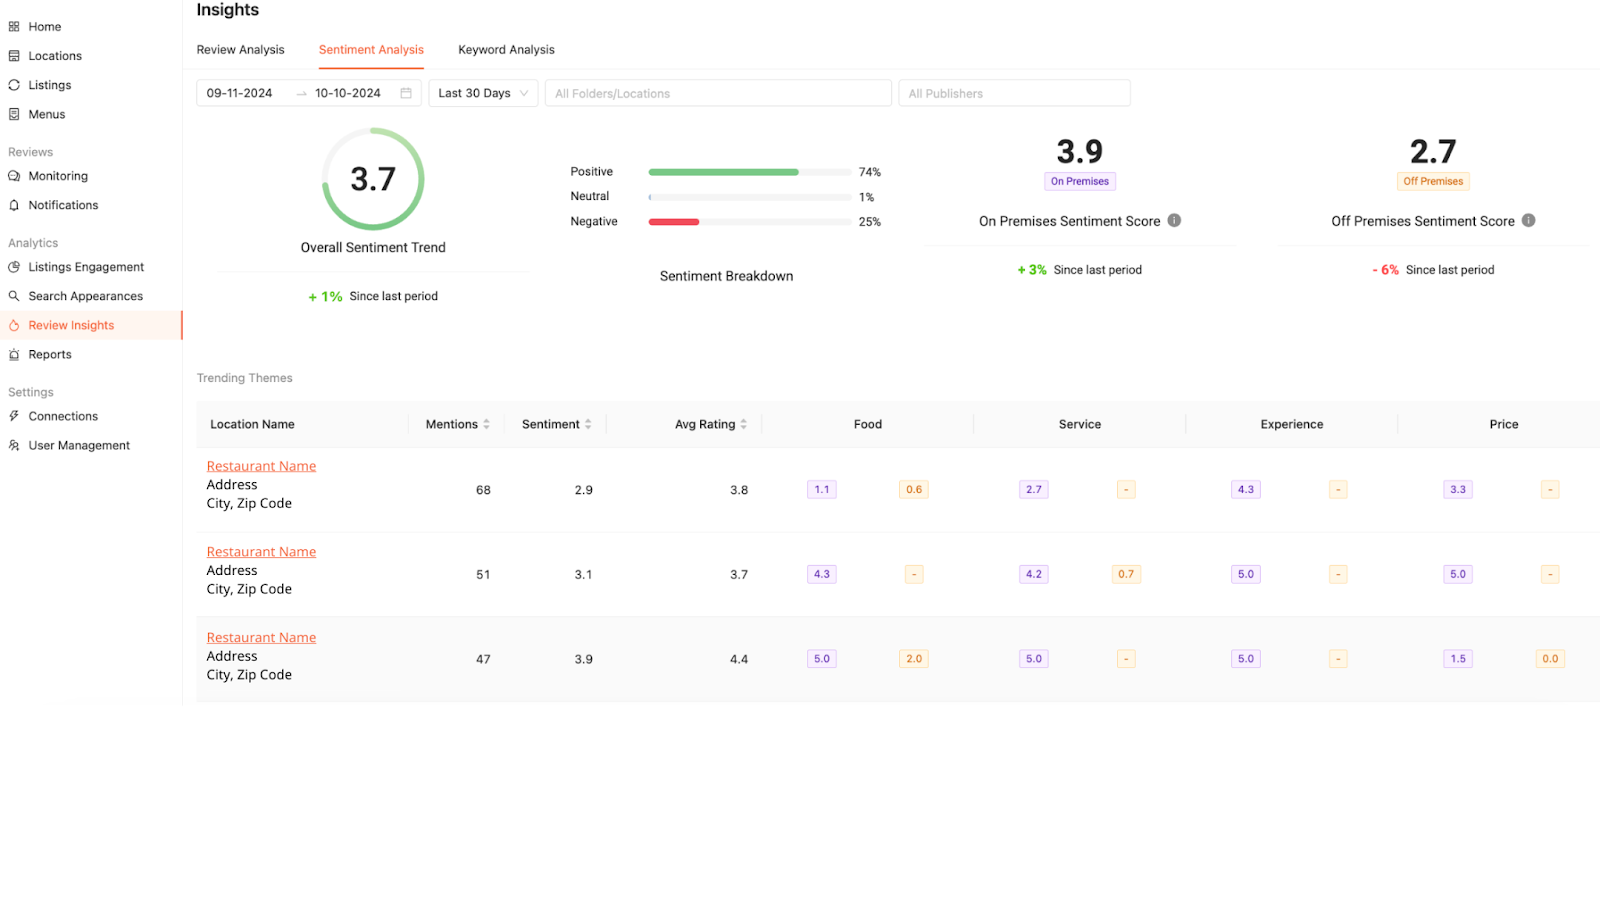
Your reviews are more than just words—they carry sentiment. The Sentiment Analysis feature does the heavy lifting for you by analyzing reviews to reveal whether they are positive, negative, or neutral. You'll even get a sentiment score that gives you a quick overview of how your customers feel about their experience. If negative sentiments are creeping up, you’ll know exactly when to step in and make changes.
Marqii will give you a score based on the context of your review. For example, if a review includes keywords like “service was great” and “loved the food”, but also has negative keywords like “wait was too long,” your sentiment score would include both the positive and negative keywords. This way, you can be sure the data you are viewing is accurate and unbiased.
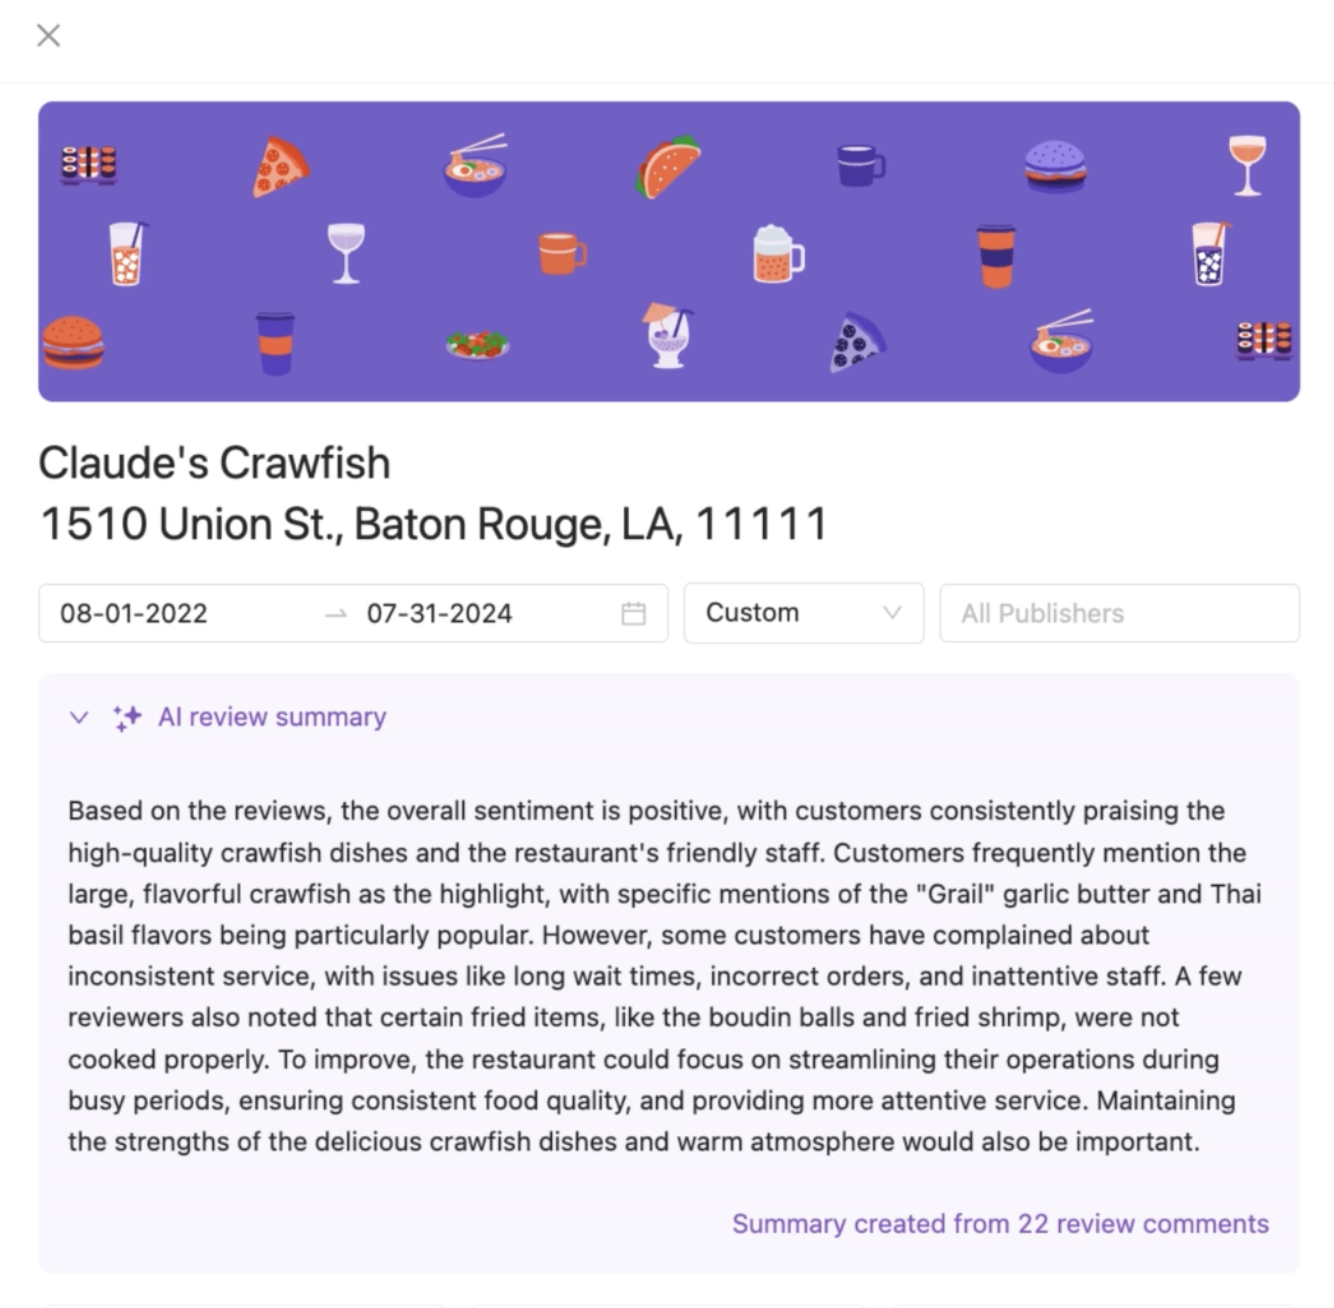
For a quick snapshot of what your customers are saying in reviews, you can use our newest feature: AI Review Summaries. This will give you a summary of the most common trends in your reviews for a selected time range.
Keyword Analysis
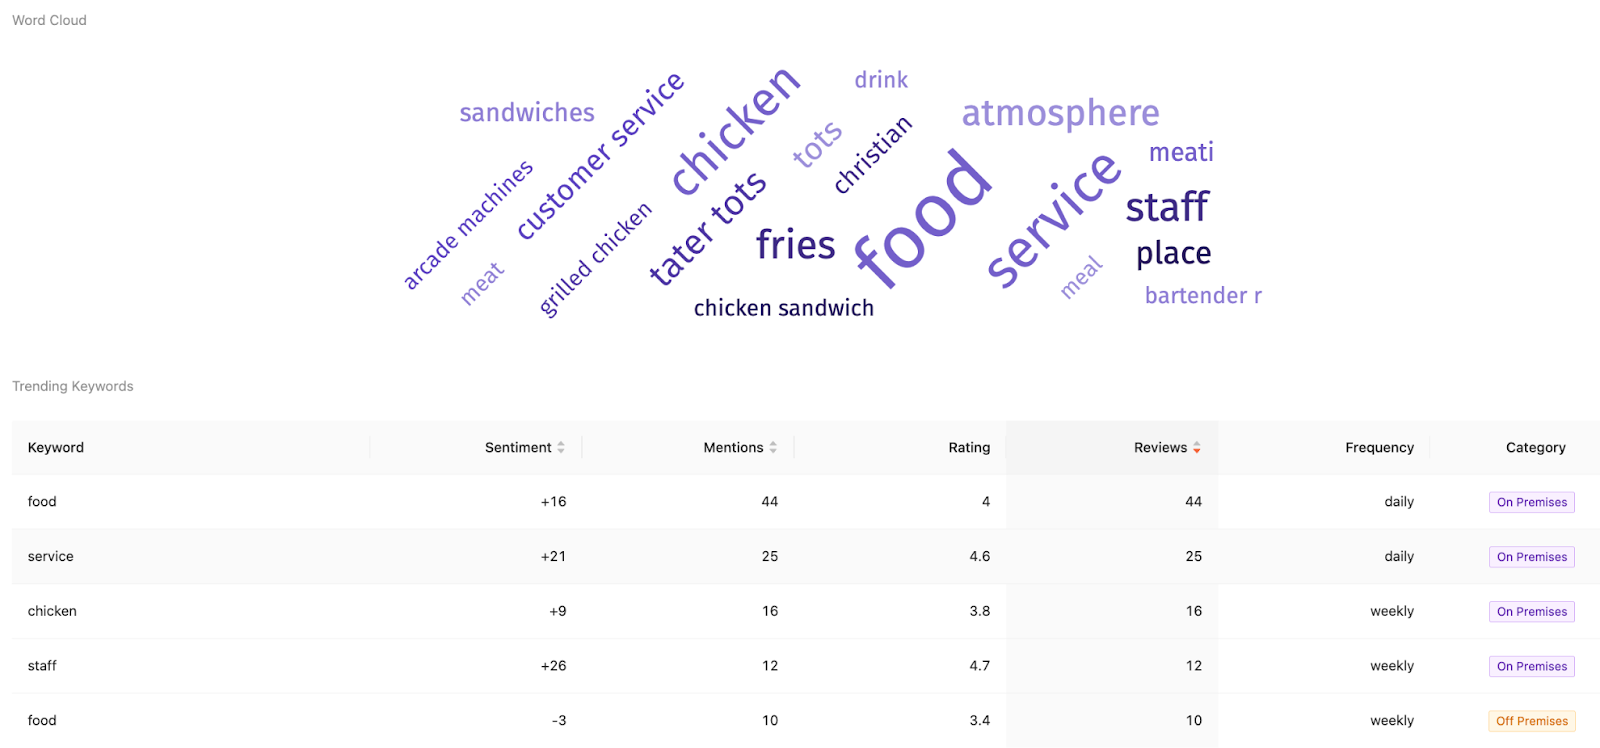
The Keyword Analysis section presents a word cloud of the most frequently mentioned words in your reviews, categorized by positive or negative sentiment. Want to know what customers love most about your tacos or why some might not be happy with delivery times? This feature lets you spot trends at a glance, helping you address customer feedback both on-premise and off-premise.
Making Data Work for You
Each of these sections works together to give you a comprehensive view of your restaurant’s digital performance. By regularly reviewing these insights, you can make smarter, data-driven decisions that enhance customer experience, improve SEO, and ultimately boost revenue.
Not on the Marqii dashboard yet? Schedule a Demo today to learn more.
Using Marqii means you can easily manage your online:


