Marqii Upgraded Analytics: Smarter Insights for Restaurants
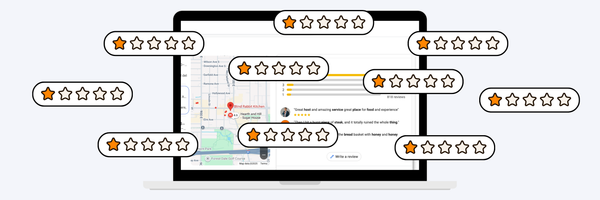
Managing online reviews can be overwhelming, but knowing what your guests are really saying (and how your team is responding) shouldn’t be.
That’s why we upgraded the Marqii Analytics dashboard. With clearer, more actionable insights across reviews, sentiment, and keywords, Analytics helps you stop guessing and start making guest-driven improvements for all your locations.
Here’s what’s new—and more importantly, what it means for you as a restaurant operator.
Review Analysis: Get the Full Story on Your Reviews
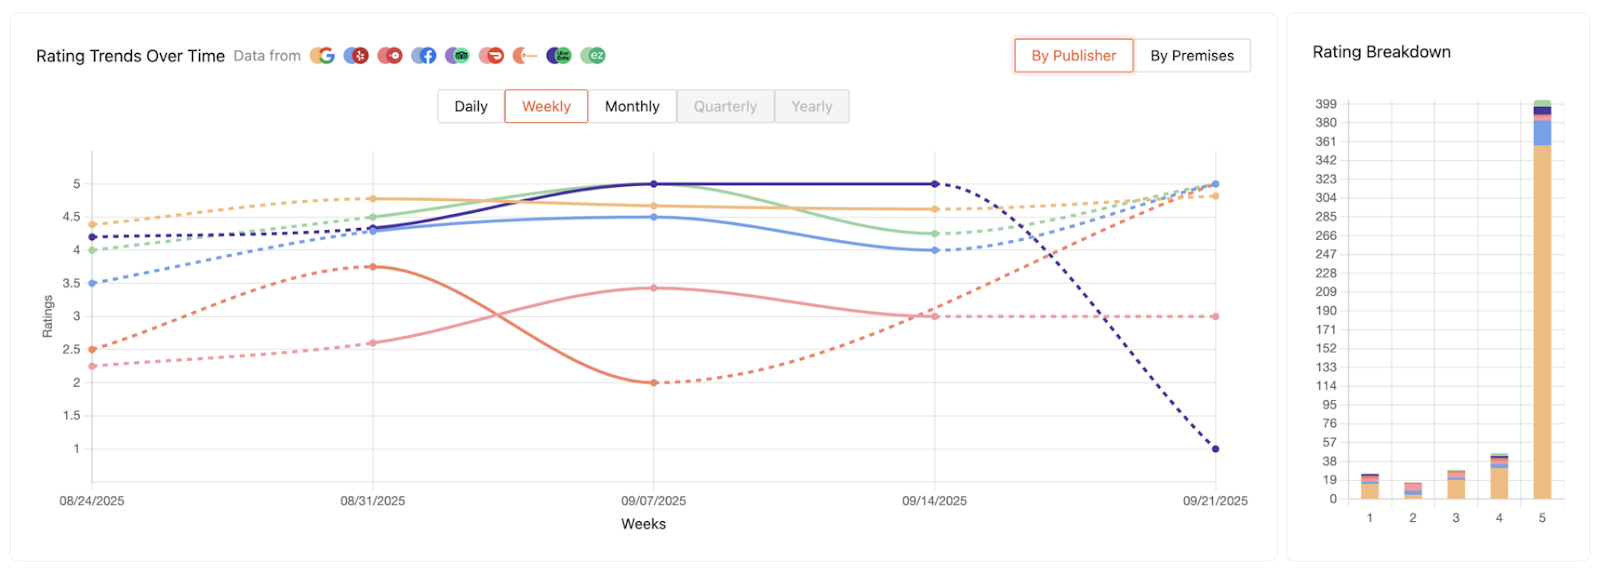
The Review Analysis page gives you a detailed look at your ratings, response rate, response time, and review frequency. You can analyze reviews at both the location and publisher level to compare performance, identify trends, and uncover opportunities for improvement.
Metrics include:
- Total Reviews – The total number of reviews within your selected date range.
- Response Rate – The percentage of reviews your team responds to.
- Response Time – The average time it takes to respond.
- Review Frequency – The average number of reviews per day.
These insights help you track activity, measure responsiveness, and understand how guests perceive your locations.
What’s New in Review Analytics
- Response rate and response time are now front-and-center.
- Updated trend graph with premise/publisher toggle.
- Rating breakdown chart that shows # of reviews per star rating.
- Location performance stats, with response metrics.
- # of reviews per star rating, for each location
- PDF & CSV exports with all new metrics.
Why It Matters for Restaurants
- Spot slow response times before they affect guest loyalty.
- See which platforms or locations need more attention.
- Track improvements in review management at a glance.
- Share easy-to-digest reports with your team or leadership.
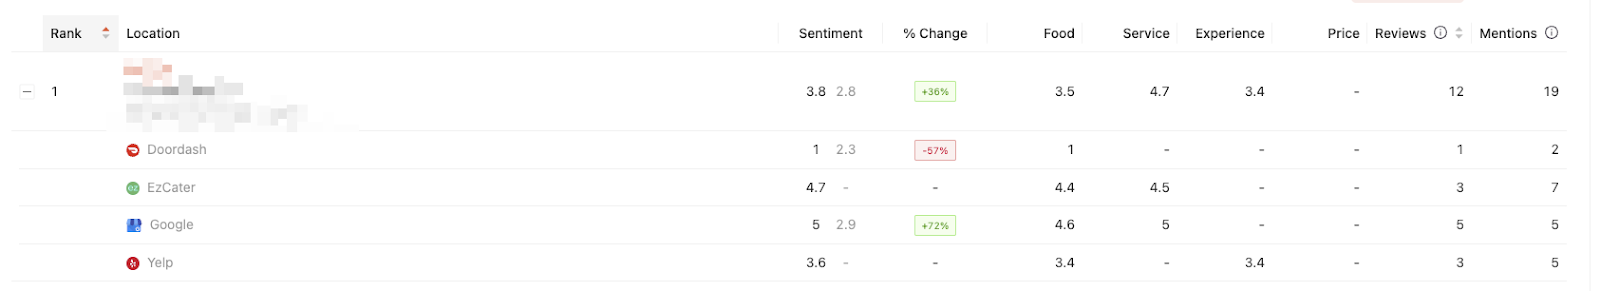
Sentiment Analysis: Go Beyond Star Ratings
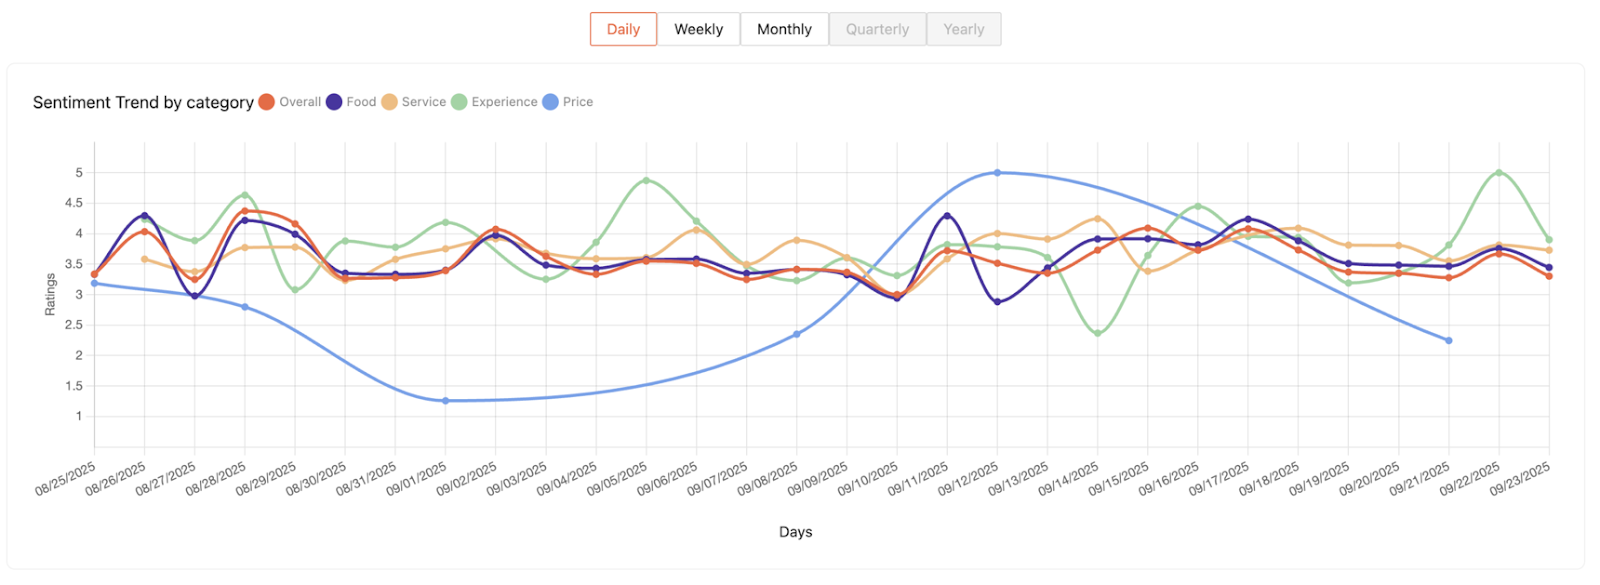
The Sentiment Analysis page evaluates the tone of customer feedback—positive, negative, or neutral—so you can measure guest satisfaction and identify areas of improvement. Sometimes, guest sentiment does not match their review’s star rating, so these detailed analytics are crucial for understanding the full scope of their experience.
Metrics include:
- Overall Sentiment – The full breakdown of positive, neutral, and negative feedback.
- Category Sentiment – Sentiment scores for food, service, experience, and price.
- Trend Graph – See how sentiment shifts over time (daily, weekly, monthly, quarterly, or yearly).
- Location Performance – Compare sentiment by location with expandable details.
These insights help you understand guest perceptions and track satisfaction across all your locations.
What’s New in Sentiment Analytics
- Expanded sentiment scores now include overall, food, service, experience, and price.
- New sentiment trend graph tracks changes over time.
- Location performance table now displays all sentiment scores in one place.
- Expanded view allows sentiment breakdown by premise or publisher.
Why It Matters for Restaurants
- Understand not just “good” or “bad,” but the why behind guest feedback.
- Catch early signs of issues in service, food, or pricing.
- Compare performance across locations or channels.
- Measure the long-term impact of operational changes.
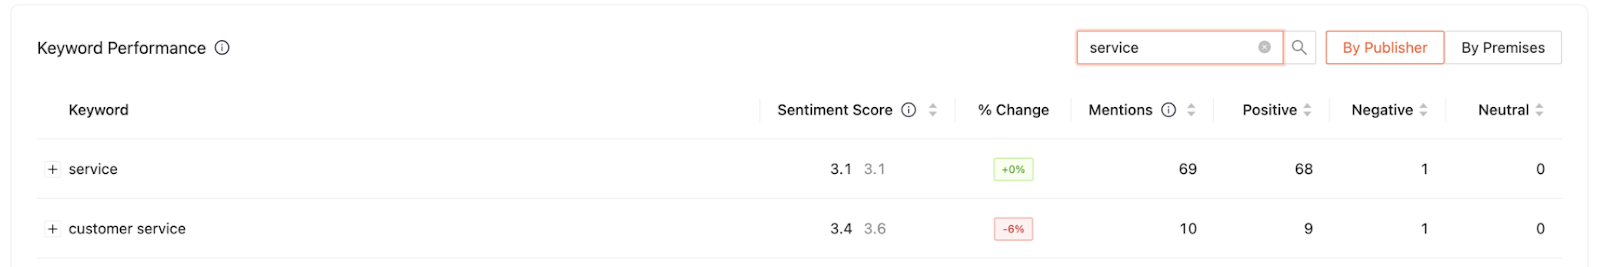
Keyword Analysis: Spot Topic Trends in Guest Feedback
The Keyword Analysis page identifies the most frequently mentioned words and phrases in your customer reviews, broken down by sentiment (positive, negative, or neutral). This helps you understand what topics drive feedback and what aspects of your business guests value most.
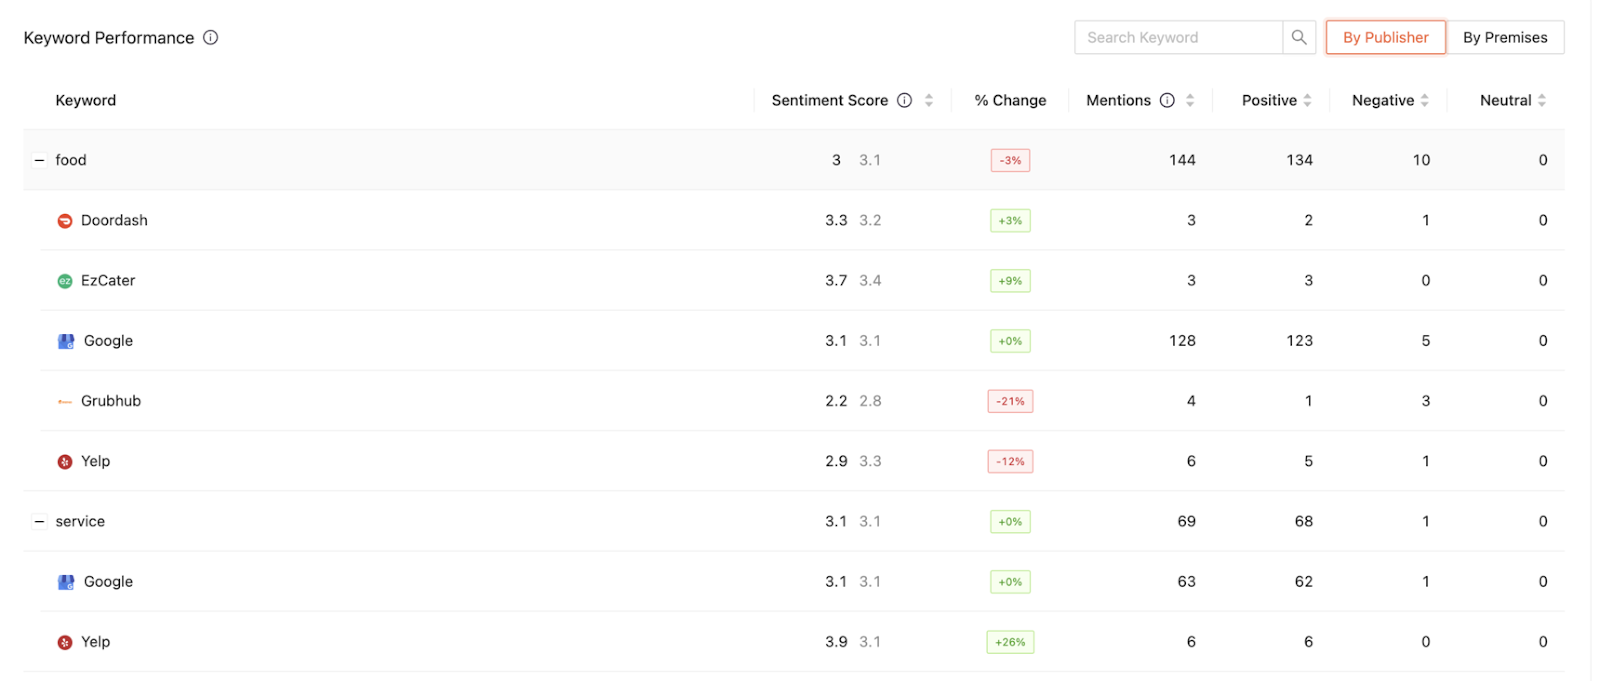
Metrics include:
- Sentiment Score – Average sentiment rating for on-premises vs. off-premises mentions.
- % Change – Change in Sentiment Score compared to the previous period.
- Mentions – How many times a keyword appears by premise type.
- Positive/Negative/Neutral – Sentiment distribution of each keyword.
These insights help you recognize recurring issues, highlight guest favorites, and inform menu, service, and marketing strategies.
What’s New in Keyword Analytics
- Cleaned up headers for a clearer experience.
- Added pagination to view all keywords.
- Expanded keyword breakdown by premise and publisher.
- New keyword search to quickly find mentions of specific items or issues.
Why It Matters for Restaurants
- Identify recurring compliments and complaints across reviews.
- Pinpoint where certain issues are most common (by location or platform).
- Track mentions of specific dishes, staff, or experiences.
- Use real guest language to guide promotions and marketing campaigns.
The Bottom Line
Marqii Analytics were designed to give you clearer, more actionable insights so you can deliver better guest experiences and improve reputation management (without the guesswork).
Ready to see it in action? Schedule a demo today and let’s chat about how Analytics can transform the way you understand your guests.